Top MT4 Indicator for Traders
welcome to tradewizards.
In the fast-paced world of financial trading, making informed decisions can be the distinguishing factor between success and failure. As more traders turn to technology for insights, MT4 indicators have emerged as vital tools for technical analysis. These indicators provide traders with the ability to uncover patterns, gauge market momentum, and identify crucial entry and exit points.
In this article, we will delve into the significance of MT4 indicators, exploring various types and their unique features. We will showcase the best indicators every trader should consider integrating into their trading strategies, emphasizing how these tools can enhance decision-making processes. Whether you’re a novice looking to understand the basics or a seasoned trader seeking to refine your approach, this guide offers valuable insights into leveraging MT4 indicators.
Read on to discover how you can elevate your trading experience and maximize your potential profits!
Section1: Understanding the Concept and Importance of MT4 Indicators
1.1 Definition of MT4 Indicators
MT4 indicators are tools that assist traders in analyzing price data to identify better entry and exit points. These indicators are based on historical data and help in making more informed trading decisions. By utilizing mathematical calculations and graphical representations, MT4 indicators allow traders to visualize price trends, strengths, and potential reversals. These indicators are integral to technical analysis, serving as a guide that helps traders interpret price movements in a systematic manner. From identifying potential upward trends to recognizing price corrections, effectively using MT4 indicators can significantly increase a trader’s chances of making profitable trades.
1.2 Importance of Using MT4 Indicators
Utilizing MT4 indicators can reduce risk and increase trading efficiency. These indicators provide buy and sell signals, offering traders more accurate information regarding market conditions. By analyzing data through these indicators, traders can capitalize on potential opportunities. Moreover, the proactive use of indicators allows traders to avoid emotional decision-making, which can often lead to mistakes. Since MT4 indicators rely on concrete data, they serve as a rational framework supporting trading decisions. In an ever-volatile market, having these tools at your disposal can make a marked difference in trading success.
Section2: Types of MT4 Indicators
2.1 Trend Indicators
Trend indicators help traders identify the overall direction of the market. Recognizing trends is one of the most critical aspects of technical analysis. By understanding whether the market is in an upward or downward trajectory, traders can align their positions with the prevailing market sentiment. Examples of these indicators include the Simple Moving Average (SMA) and the Relative Strength Index (RSI). The SMA smooths out price data to create a trend-following indicator, while the RSI measures the magnitude of recent price changes to evaluate overbought and oversold conditions. Both of these tools are widely utilized and can provide traders with valuable insights into market behavior.
2.2 Oscillator Indicators
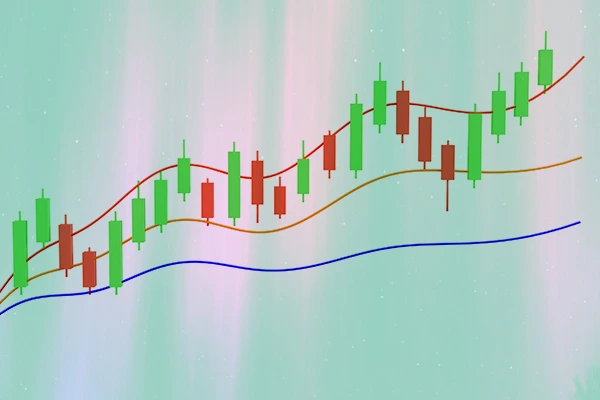
Oscillator indicators help in identifying overbought and oversold conditions, thus providing potential price reversal points. They oscillate around a central line and can signal whether an asset should be bought or sold. Among these are popular tools like the Stochastic Oscillator and Bollinger Bands. The Stochastic Oscillator compares a specific closing price of an asset to a range of its prices over a certain period, helping determine whether an asset is overbought or oversold. On the other hand, Bollinger Bands consist of a simple moving average line and two standard deviation lines, offering insights into market volatility and potential price breakouts.
Section3: Best MT4 Indicators
3.1 SMA Indicator
The Simple Moving Average (SMA) is one of the most common indicators that helps traders calculate the average price of an asset over a specific period. This indicator aids in identifying entry and exit points and can provide effective buy and sell signals.Traders often use different lengths of SMA (such as50-day or200-day) to understand short-term and long-term market trends, making it easier to spot potential trend reversals. By crossing the SMA, traders can identify when to enter or exit trades, which is vital for effective trading strategies.
3.2 RSI Indicator
The Relative Strength Index (RSI) is another crucial indicator that measures the speed and change of price movements of an asset. Typically calculated on a scale of0 to100, the RSI can indicate overbought and oversold conditions.A value above70 typically indicates that an asset may be overbought, while a value below30 may suggest that it is oversold. This information can guide traders in making informed decisions about potential entry and exit points, helping them manage their trades more effectively.
Section4: Tips for Using MT4 Indicators
4.1 Combining Multiple Indicators
Using multiple indicators can enhance the accuracy of analysis.
By combining trend and oscillator indicators, traders can identify more reliable signals. For example, pairing the Simple Moving Average (SMA) with the Relative Strength Index (RSI) may provide strategic points for entering trades. This combination allows traders to identify potential trends while simultaneously assessing market conditions.Furthermore,
using a combination of short-term and long-term indicators can provide a comprehensive view of market dynamics.
Short-term indicators can signal immediate opportunities, while long-term indicators can help clarify the overall market trend, ensuring that traders are not making impulsive decisions based on temporary price movements.
Traders should also consider implementing more advanced indicators such as Moving Average Convergence Divergence (MACD) along with others to validate their trading strategies. By using the MACD in conjunction with SMA and RSI, traders can gain confirmation on whether a trend is strong enough to enter or exit a position.
This multi-faceted approach significantly minimizes the chances of false signals that may occur when relying solely on one indicator.
4.2 Understanding Market Conditions
Before using indicators, it is essential to analyze the overall market conditions comprehensively.
Paying attention to economic news and the broader market environment can aid in your decision-making process.
This involves not only monitoring market trends but also being aware of geopolitical events, interest rate changes, and economic reports that could impact asset prices. By understanding how external factors influence market behavior, traders can develop a more comprehensive trading strategy. For instance, if a trader identifies a bullish trend via indicators but is aware of negative economic news that could affect that trend, they might choose to act cautiously. Moreover, it’s crucial to remember that no indicator is100% accurate.
Each indicator has its strengths and limitations; therefore, it’s vital to maintain a healthy skepticism of any signals the indicators may provide. Always conduct additional analysis before making trading decisions based solely on indicators.
4.3 Adjusting Time Frames
Another essential tip is to utilize different time frames for evaluating indicators. Many traders focus on one time frame, but varying your analysis can provide deeper insights. For example, a trader may observe a bullish pattern on a daily chart but might spot a bearish reversal on an hourly chart. This discrepancy can guide traders on when to enter or exit trades.
By looking at multiple time frames, you can gain a clearer understanding of the context surrounding price movements, which can further enhance your decision-making. For instance, if both daily and weekly trends align, the confidence in your trade decision increases.
4.4 Back testing and Simulation
Back testing strategies using historical data can provide valuable insights into how well certain indicators have performed in the past. By simulating trades based on historical data, traders can evaluate the effectiveness of their strategies and make necessary adjustments without risking real capital. Through backt esting, you can assess how combining different indicators would have fared under various market conditions. This process not only helps in building confidence in your strategy but also fine-tunes your approach. Additionally, many trading platforms, including MT4, offer demo accounts where traders can practice their strategies in real-time without financial consequences.
4.5 Continuous Learning and Adaptation
The financial markets are dynamic, requiring continuous learning and adaptation. As market conditions change, what works today may not work tomorrow. Therefore, staying updated with market trends, changes in indicators, and advancements in trading strategies is essential.


