Weekly technical and fundamental analysis of Gold – February 25th
The global gold ounce in the week ending on Friday, February 23, failed to take advantage of the overall weakness of the US dollar and traded within a narrow range up and down before finally ending its working week.
However, global gold gave a profit of +1.1% to its supporters last week.
Now all eyes are on another inflation indicator in the US, the PCE index. It is likely that if gold cannot stabilize itself above $2030, which it has unsuccessfully tried to break through multiple times last week, market bulls will not enter the market.
Events of the past week in the gold market:
The global gold ounce opened last Monday with a price of $2013 at the start of the working week, dropped to $2000, but immediately rose to around $2023 with market bulls’ intervention.
The reason for limited gold profits on Monday was the closure of the stock and bond markets in the United States due to Presidents’ Day.
On Tuesday, due to a change in market sentiment from negative to positive, the US dollar could not shine, and this important factor allowed global gold to successfully increase to the important resistance level of $2023.
Then came Wednesday; the day when the market and all investors awaited the first important meeting of the Federal Reserve’s Open Market Committee members in 2024.
On Wednesday, the head of the Federal Reserve (FED) announced during the policy-setting council meeting related to January that most policymakers have pointed out the risks associated with very rapid rate cuts.
Another important point was that most officials at the Federal Reserve are not confident about how long interest rates should be kept in the current range of 5.25 to 5.5 percent and are hesitant!
Since this issue was completely hawkish and in support of the Fed’s contractionary policies, as a result, the yield on 10-year US Treasury bonds grew by exactly 1 percent, causing gold profits to turn into losses (in fact, global gold fell to around $2019).
Then on Thursday, during the Asian trading session, the market sentiment turned into a risky environment and traders turned to high-risk and profitable assets.
This caused the dollar to come under selling pressure and gold managed to rise to around $2035.
The impact of the Asian market spread to Wall Street, and the S&P 500 index opened in the green and rose by about 1 percent, leading this major stock index to set a historical record.
Then, the Nasdaq composite index also grew by 3 percent due to the growth of technology-related stocks.
A little later, during the New York trading session, strong data released from the United States allowed for further growth in bond yields, and despite the widespread weakness of the dollar, made it difficult for gold to gain upward momentum.
As you are aware, Thursdays are usually waiting for an important report on US unemployment claims, which is one of the indicators related to employment and labor.
According to the latest reports, it was revealed that the number of individuals filing for unemployment benefits for the first time in the week ending February 17 decreased by 12,000 to 201,000 (as you know, usually the lower this figure, the stronger the US dollar becomes and gold weakens).
Then, the analyses conducted by the global institution S&P showed that business activities in the private sector of the United States continued to grow at a decent pace in early February.
Immediately after this news was released, the yield rate on 10-year US Treasury bonds soared to 4.35 percent for the first time since November.
As you are aware, influential officials at the Federal Reserve make statements during working days that usually have a significant impact on financial markets, especially on the dollar, gold, and bond yields.
On Thursday, after the mentioned data was released, Christopher Waller, a member of the Federal Reserve Board of Governors, indicated the need for more evidence of inflation reduction, stating that he and his colleagues are not in a hurry to start lowering interest rates.
In fact, Waller argued that premature interest rate cuts could undermine inflation progress and cause significant damage to the economy.
However, gold, according to Waller’s statement, did not show a negative reaction as expected and even on Friday, despite a decrease in trading volume, gold rose to around $2041 and eventually closed the week at $2035.
Events in the forex market and gold for the upcoming week
do not show any significant news for America on Monday in the forex economic calendar, and the market will start its work with news of durable goods orders in America on Tuesday of next week.
It is predicted that durable goods orders will decrease monthly and after remaining steady in December to 4.5 percent.
Although it is unlikely that this report will create a significant reaction in the market, an unexpected positive figure can support the dollar and cause a decline in global gold prices.
Then, on Wednesday of next week, the Bureau of Economic Analysis (BEA) is set to release its second estimate of fourth-quarter 2023 US Gross Domestic Product (GDP).( Remember, markets do not anticipate a revision of the initial estimate of 3.3% growth.)
Thursday is also the day when the market awaits the important report on Personal Consumption Expenditures (PCE) in the US. (Remember, this inflation gauge is a favorite measure of the Federal Reserve officials.)
Economic analysts have predicted that the monthly core PCE, the central bank’s preferred inflation gauge, will increase from the previous figure of 0.2% to 0.4%.
Keep in mind that the market is highly confident that the Federal Reserve will not or cannot lower interest rates at its March meeting. The current probability of interest rate cuts in May is around 20% based on CME Group tools.
On the other hand, the situation and sentiment surrounding the US dollar for further increases, even if the PCE report shows that rates will not be lowered until June, are very low!
However, if the PCE inflation report shows a number close to 0.2% or lower, this could fuel speculation about the start of interest rate cuts in May.
If this scenario materializes, the yield rate on 10-year US Treasury bonds will decrease and global gold prices will start to strengthen.
Finally, on Friday, the last trading day of the forex market, investors will have the Purchasing Managers’ Index (PMI) reports for both manufacturing and non-manufacturing sectors in China.
Remember, if both of these reports show a number above the important 50 level, optimism about increased demand for more gold purchases will rise, and the global gold ounce price will strengthen.
Weekly technical analysis of gold
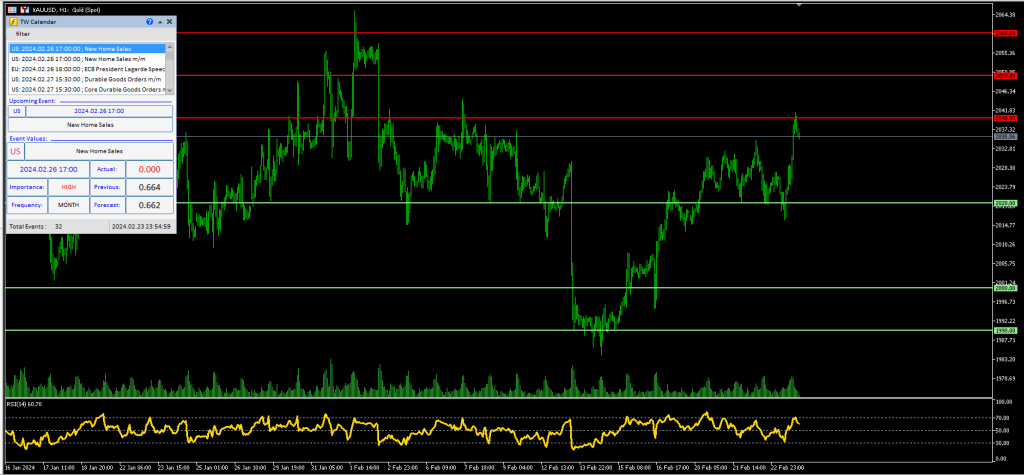
shows that the price range for gold last week was between $2000 and $2041. If you open a daily chart of gold right now and plot an RSI indicator, you will see that the indicator peak is moving upwards and showing a value of 55.
This means that currently the market bulls are in control, and the important 50-day moving average, which has acted as a key support level for several months and had pushed gold prices higher, has now shifted below the current gold price.
If gold can stabilize above this important support level next week, we can expect the upward trend in global gold ounce prices to continue in the daily timeframe.
From a technical perspective, this 50-day moving average had played an excellent support role for global gold for several months.
Key support levels in the analysis of global gold ounces:
If gold were to decline, the first significant support level would be the important area of $2020. If gold penetrates below this area, the next key price level is $2010. If bears push gold lower, the next important levels would be $2000 and $1990.
Key resistance levels in the analysis of global gold ounces:
If gold rises, the first significant resistance level would be $2040. If gold successfully surpasses this area, the next important level would be $2050. If market bulls manage to push gold higher, the next resistance levels would be $2060 and $2070.
Disclaimer: This article is for educational purposes only and should not be considered financial advice.
Happy trading
may the pips be ever in your favor!


