Weekly Technical and Fundamental Analysis of Gold – March 24
The global gold ounce managed to set a new and historic record for itself and its supporters by the week ending March 22. However, from the second half of last week, global gold began to decline or, better said, corrected itself.
The main reason for gold’s return to the downside was strong data from the United States that caused all speculations about the start of the Federal Reserve’s interest rate reduction process to diminish.
Last week’s events for gold:
Last week, on the first working day of the Forex market, the global gold opened at a price of 2156 and went up to 2163 dollars; in fact, the global ounce ended its first day in a calm and low volatility state.
The main reason for this session’s inactivity was the important meeting of the Federal Reserve on Wednesday, where the whole market was waiting to hear news and statements from Federal Reserve officials.
On Tuesday, gold was in a similar situation to the previous day and after opening at 2160, it dropped to 2147 and finally closed at 2157, ending its working day.
Then came Wednesday, the day when the entire market awaited the Federal Reserve’s statement in March.
Last Wednesday, as predicted, the Federal Reserve left its interest rates unchanged in the range of 5.25 to 5.5 percent.
What was important for traders and the entire market was reading the prediction of the future economic situation of the United States, which is famous for the Dot Plot chart.
The March Dot Plot chart showed that Federal Reserve officials are still expecting three interest rate cuts of 75 basis points for the current year 2024. This prediction was consistent with December 2023.
The initial market reaction to this news was that the yield on U.S. ten-year Treasury bonds began to decline and had negative effects on the U.S. dollar. The reason for this reaction was that traders started speculating that the Federal Reserve will reduce its rates from June onwards.
It is worth mentioning that the well-known interest rate predictor tool CME Group showed a decrease in the probability of the Federal Reserve leaving its rates unchanged in June from 40% to 25% before the statement and reading of the dot plot chart.
Jerome Powell, the Chairman of the Federal Reserve, adopted a relatively optimistic tone about the future inflation outlook of the United States in a press conference after this important meeting, forcing the dollar to remain under downward pressure.
Powell admitted that inflation numbers in January and February have been “very high,” but emphasized that these data have not changed the overall story about inflation reduction and he and his colleagues have inferred that this issue is mostly due to seasonal effects.
As the selling of the US dollar increased in the Asian trading session on Thursday, XAU/USD started its upward rally towards its highest historical record of $2220.
However, later on the same Thursday, due to the release of strong economic data from the US, the dollar began to strengthen against its competitors, causing global gold to start returning to the downside.
Further details of the reports on Thursday are as follows:
- The US Department of Labor reported that initial claims for unemployment benefits for the week ending March 16 decreased to 210,000.
- In addition, the World S&P Institute announced that the US composite purchasing managers’ index in March increased to 52.2% in the initial estimate, indicating that economic activities in the US private sector have grown at an acceptable pace.
- Chris Williamson, Senior Business Economist at the World S&P Institute, commented on the survey findings about PMI: The increasing rise in costs along with strengthening pricing power against the backdrop of recent demand growth signifies renewed inflationary pressures in March.
- Meanwhile, the unexpected decision of the Swiss National Bank (SNB) to reduce interest rates by 25 basis points and the negative statement from the Bank of England’s (BoE) Monetary Policy Committee led to capital outflows from the British pound and Swiss franc.
This important factor caused the dollar to rise further on Thursday.
In fact, two members of the Monetary Policy Committee of the Bank of England named Jonathan Haskel and Catherine Mann, who had voted for a 25-basis-point rate hike in the previous meeting, this time voted to keep interest rates unchanged at their current levels, while Swati Dingra continued to push for a 25-basis-point rate cut.
Ultimately, due to the strengthening of the US dollar overall on the last trading day of the week, global gold continued its decline to below $2160 and ultimately ended the week at $2165.
Gold outlook for the upcoming week:
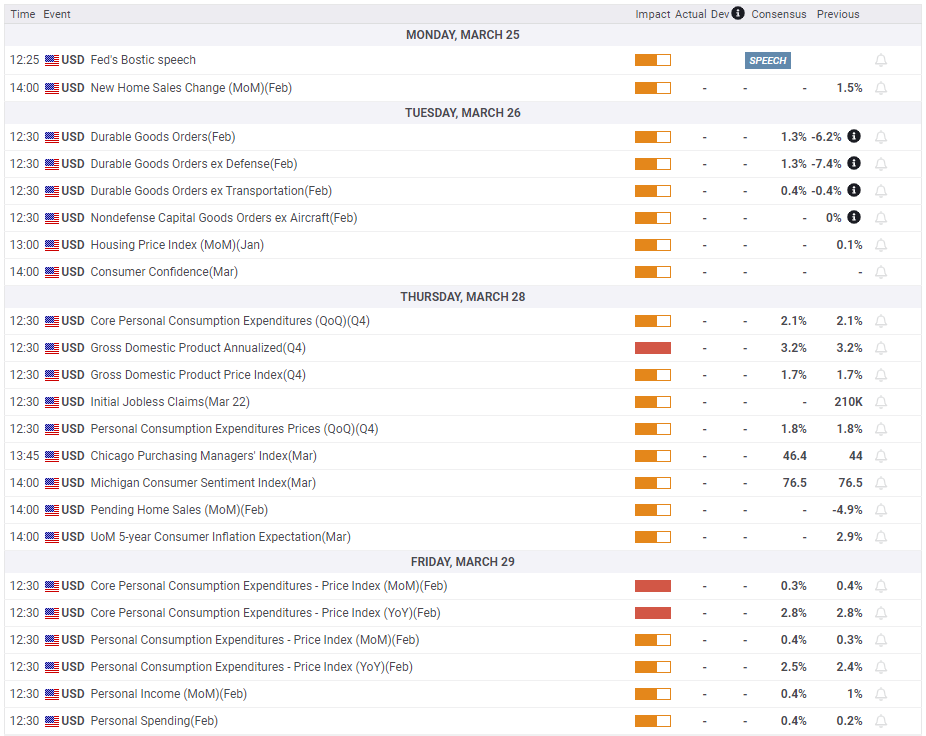
On Monday, with the start of the forex trading week, no significant news is expected for the dollar and gold, and important news is actually expected to start from Tuesday.
The United States is set to announce durable goods orders for the month of February on Tuesday, and the Conference Board also intends to release the Investor Confidence Index for February.
The US Bureau of Economic Analysis (BEA) is also expected to release its latest estimates and evaluations for the fourth quarter US Gross Domestic Product (GDP) and Personal Consumption Expenditures (PCE) index on Thursday.
What is the PCE index?
The Personal Consumption Expenditures Price Index, commonly known as the PCE index, evaluates changes in prices of goods and services purchased by consumers in the United States. The PCE index is used to record inflation across a wide range of consumer costs and reflects their behavior.
Since households are one of the fundamental components of the circular flow of the economy, their choices and decisions regarding consumption are one of the most important or perhaps the most important aspects of economic interpretations.
Keep in mind that consumers allocate a significant portion of their income to consumption during the year, and consumption accounts for almost 70% of US Gross Domestic Product. Therefore, the role of consumption and consumer spending planning in the economy is very important.
The market expects US GDP in the fourth quarter of 2023 to remain at the previous figure of 3.2%. Remember that market reaction to this report is very quick, but its effects on the market will be short-lived.
Remember, if for any reason this figure is higher than 3.2%, the US dollar will strengthen and global gold will come under downward pressure. Conversely, if the reported figure is lower than expected, the US dollar will weaken and gold will start to strengthen.
It is true that traders closely follow the important PCE index, but because the US stock and bond markets are closed on Friday due to “Easter” trading volume decreases significantly.
But don’t forget that this reaction could manifest itself on Monday with the start of the forex trading week.
If for any reason the PCE index is better than market expectations and higher than predicted, the US dollar will strengthen on the first day of the week, which is Monday.
Conversely, if the reported figure is less than 0.3%, the dollar will weaken and gold will start to strengthen.
Weekly Gold Technical Analysis
The price floor and ceiling for gold in the past week were $2146 and $2222. If you open a daily gold chart right now and plot an RSI indicator, you will see that the peak of this indicator is moving downwards within the overbought zone and showing a value of 64.
This means that control is still in the hands of market bulls, but global gold has finally started its correction from its historical high.
Furthermore, if you draw an ascending channel on the daily chart at this time, you will notice that global gold, which had exited its channel ceiling, has returned inside this channel.
Key Support Levels in Global Gold Analysis
If gold is to decline, the first significant support level will be the important area of $2160. If gold penetrates below this area, the next important price level is $2150. If market bears push gold lower, the next important levels will be $2140 and $2130.
Key Resistance Levels in Global Gold Analysis
If gold increases, the first important resistance level will be $2180. If gold successfully passes through this area, the next important level is $2190. If market bulls succeed in pushing gold higher, the next resistance levels will be $2200 and $2222.
Disclaimer: This article is for informational purposes only and should not be considered financial advice. Please consult with a qualified financial advisor before making any investment decisions.
Happy trading
may the pips be ever in your favor!


