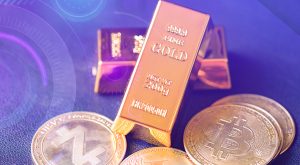
Investment: Gold or Bitcoin?
in 2024 so far, which has offered better opportunities? Let’s examine technical and fundamental analysis along with experts’ opinion

in 2024 so far, which has offered better opportunities? Let’s examine technical and fundamental analysis along with experts’ opinion

“Japanese Candlestick Charting Techniques” by Steve Nison, offers a compelling introduction to a powerful, yet surprisingly straightforward, method.
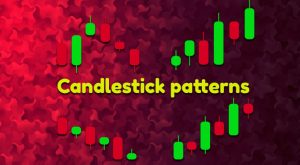
Candlestick charts are the cornerstone of technical analysis and provide a wealth of price information in one visual display.
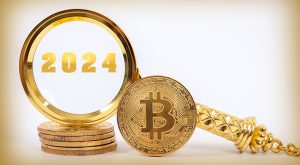
Fundamental and technical analysis of Bitcoin this year and the possibility of its growth to the expected targets for traders
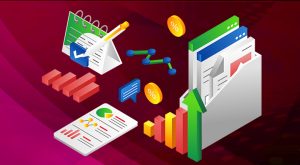
For any aspiring forex trader, navigating the dynamic currents of the market requires more than just technical analysis and a gut feeling.

Margin calls, the dreaded words echoing through the ears of every forex trader, signal a potential financial disaster….
This week global gold investors are likely to ignore technical signals and analysis when important US economic news is released.
With examples and an emphasis on risk management, this book equips traders with the tools they need to make their trading decisions.
In this article, we introduced the trading strategy used by traders in the forex market and digital currencies in general.

While technical indicators and charts provide valuable insights, understanding the underlying economic forces is critical to successful trading.